Drawing by Numbers is a new resource for data journalists and activists interested in using data and design for advocacy. As part of this resource we profile data visualisation tools that are designed to give someone with no previous knowledge an introduction to what these tools can offer. The tools we profile are either free or open source and are organised into four categories: charts and graphçs; mapping and mashups; design, layout and presentation; and data management tools. We have profiled 21 tools so far and are adding to that number, recent reviews include Data Wrangler a tool for 'cleaning' up your data and Gephi a tool used to create network graphs.
(video)
10 Tactics Worldwide from Tactical Technology Collective on Vimeo.
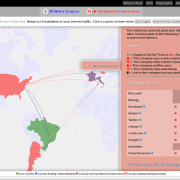
With the help of local Berlin designers, Julia Wolf and Daniel Páez, we visualised the 219 screenings of 10 Tactics from late 2009 until 2012.


