We've just published the fourth and fifth in our series of Data and Design How-tos on our Drawing by Numbers site.
Data & Design How-to's Note 4: Visualisation basics – the three 'gets'
Find out how to help audiences to:
-Get the idea - which is about exposing the issue, and being exposed to it
-Get the story - which is about understanding an issue
-Get the details - which is about exploring the issue
Data & Design How-to's Note 5: Get the idea
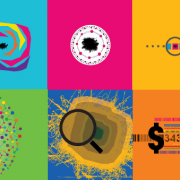
The key characteristic of products that help audiences 'get the idea' is the dominance of visual techniques. They may use data on a small scale, and transmit a little evidence directly, but they predominantly use the visual form to lead audiences in to a larger campaign or set of information.
We've also added a new tool - Gephi is an interactive tool for exploring, visualising and understanding large network graphs.


